Joel A. Larsen Principal, CERTIFIED FINANCIAL PLANNER™
I’m not sure where I first heard the term “Silly Season” to describe the stock markets’ continued rise above any reasonable valuation based on earnings, but it seems appropriate. After the passage of the 2017 Tax Cuts and Jobs Act reduced corporate tax rates from 35 to 21 percent, corporate stock buybacks began to push valuations.
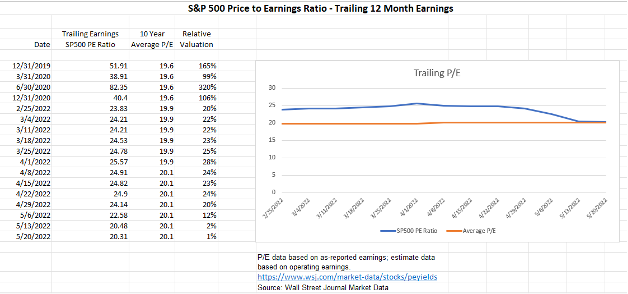
By the end of 2019, the Price to Earnings (P/E) ratio of the S&P 500 was almost 52 times trailing 12 month earnings. (Source: Wall Street Journal Market Data) This at a time when the 10 year average for this ratio was 19.6 times earnings, according to FactSet. This was 165% ABOVE the average. Even at the depths of the 2020 pandemic sell‐off, the ratio was 38.91, a 99% overvaluation. Then, during the 2nd quarter of 2020, as people were beginning to receive their stimulus checks and were sitting at home, many discovered online trading platforms like Robinhood. These new “investors” began buying against a backdrop of much of the economy being shut down and drove the S&P 500 trailing P/E ratio to 82.35 times earnings, an astonishing 320% overvaluation! Silly season indeed.
Now, after almost 2 years of corporate earnings coming online, the S&P down 17.7% year to date, and large company growth stocks down almost 36.6%i, we are FINALLY getting back to fair valuation. Not undervalued, mind you, just fair valuation.

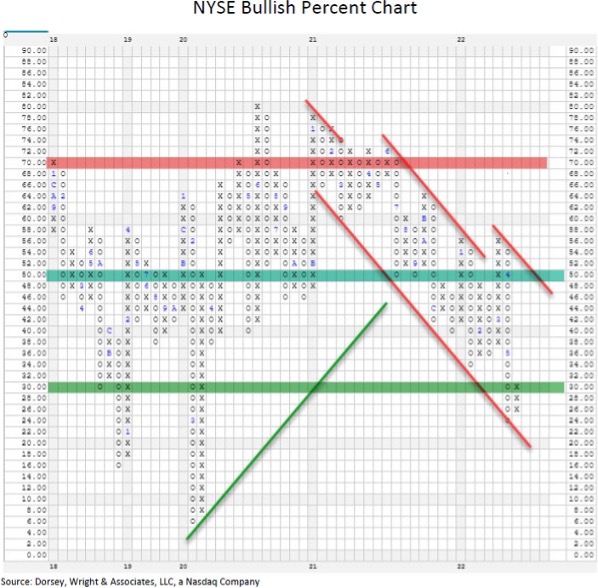
Now that we’ve looked at valuation, let’s look at the supply and demand picture:
You’ll recall that rather than recording prices over a fixed period, point and figure is a measure of supply and demand irrespective of time. Shifts occur when they occur. Xs denote upward movement, or demand, and Os denote downward movement, or an excess of supply. The letters and numbers embedded within the columns indicate the month of the year that the movement was recorded. As you will note, the years (across the bottom) are not all of the same size. That is because we only record actual changes, and some years there are more changes than others. The numbers one through nine signified January through September, and A, B and C are October through December. This particular chart does not measure price but rather the percentage of stocks on the New York Stock Exchange (really big companies) that are in uptrends versus downtrends.
I update these charts on Friday afternoons. While the major indices have been correcting since the start of the year you can see from this chart that the correction among the average stocks actually began at the beginning of LAST year. This is because indices like the S&P 500ii are “market capitalization weighted”. This means that the larger companies carry more weight in the index. Lately, the largest 15 companies in the S&P 500 accounted for 40% of the price movement! Note that the chart is now showing only 30% of stocks are in uptrends for the first time since early 2020. This represents an “oversold” level and could set the stage for what is called a “bear market rally”, which means a rally in stock prices before the market continues its correction.
This mildly oversold condition coupled with valuations being at average means that we may soon be able to move from the defensive posture we have held for quite a while now to a normal level of risk in our clients’ portfolios. There’s no rush to do so, but risk levels are certainly lower than they have been for several years. I doubt the correction is over for good, as we have yet to see other signs like corporate insiders buying their own stock with gusto, that inflation is beginning to abate (with or without a recession), and for the speculative fervor to reverse, meaning that traders stop “buying the dips”. That has not yet occurred. But we’re ready when it does.
In the meantime, we have tilted our stock holdings heavily toward “value” stocks. For those of you familiar with the term “blue chip” stocks, that’s where we are. For context, large cap value stocks are down about 19% year to date versus large cap growth stocks down almost 37% as of Friday’s close1. Mid cap value stocks are only down 2.1%. We have also shortened our bond holdings to less than 5 years, as we think the Fed isn’t anywhere near done raising rates, and bonds of this maturity don’t decline as much as longer bonds do when rates rise.
Travel Time!
Most of you know I like to see all my clients face‐to‐face at least once a year. With the pandemic, that hasn’t happened since 2019. But I can’t stand it! So this year, starting in mid to late August, I’m hitting the road. To reduce risk to my clients, I won’t be flying. It’s not the planes that concern me, it’s the airports with hundreds of thousands of people passing through every day, and all of them exhaling… So even though I am vaxxed and boosted, I’m going to drive. Yes, to all 22 states! This way I can control with how many people I come into contact and am not dragging hundreds if not thousands of potential vectors with me to my client visits. So if you’re a client, expect to hear from me in the next month or two about scheduling a visit! If you’re not a client, but would like to meet, let me know!
Finally, and as always, if you know someone who might benefit from these comments, feel free to forward them along.
Stay safe.
Joel
Any opinions expressed or implied herein are as of the date of publication and subject to change based on subsequent developments. They are those of the author alone. Any market prices are only indications of market values and are subject to change. The material has been prepared or is distributed solely for information purposes and is not a solicitation or an offer to buy or sell any security or instrument or to participate in any trading strategy. It is not intended to be legal or tax advice and is not to be relied upon as a forecast, or research or investment advice regarding any particular investment or the markets in general, nor is it intended to predict or depict performance of any investment. Investors should not assume that any investments in the securities and/or sectors described were or will be profitable. This document is prepared based on information deemed reliable; however, the accuracy or completeness of the information cannot be guaranteed. Investors should consult with a financial advisor regarding their own personal circumstances prior to making an investment decision. Additionally, readers should consult with their tax and/or legal advisors as to the impact of making any changes in portfolio or financial planning strategies.
i As of May 20th, according to Carson Research
ii The Standard & Poor’s 500 (S&P 500) is an unmanaged group of securities considered to be representative of the stock market in general. You cannot invest directly in this index.


